Friday, May 25, 2012

SQL Server Data Alerts - Email configuration has no 'server' or 'pickup directory'

I was setting up a SQL Server Reporting Services data alert for the first time and got an error.clip_image002
I searched the log file for the identifier listed in the status message in the log file under C:\Program Files\Common Files\Microsoft Shared\Web Server Extensions\14\LOGS.  I found an entry that said “Email configration has no 'server' or 'pickup directory' specified”.  My first thought was I’m the last person to nitpick others spelling, but I did think “configration” should have been spelled as “configuration”.  My second thought was I know I setup the Email Settings in the Reporting Services Configuration Manager.  I double checked and sure enough it was setup as I expected.
clip_image004
I checked under SharePoint 2010 Central Administration under Manage Service Applications and looked for the Reporting Services Application clicked on it. I then clicked on the Manage button on the toolbar.
clip_image006
I then clicked on Email Settings………
clip_image008
….and my Email Setting were empty.
clip_image010
I checked the Use SMTP server check box and filled in the Outbound SMTP server and the From Address boxes.  I went back to the report and right clicked on it and selected Manage Data Alerts and then selected the data alert and selected Run. The status message now said “Last alert ran successfully and the alert was sent.”
clip_image012
I checked my inbox and sure enough the email was there.  Now I have no excuse for not filling out my timecard.
clip_image014

Thursday, May 24, 2012

List Price for SQL Server 2012

I always seem to need a quick reference for the list price for SQL Server 2012.  I thought others would appreciate this too.
Edition Unit of Measure List Price
Enterprise per core $6,874

Business Intelligence
per server $8,592 AND
per user $209

Standard
per core $1,793

Standard
per server $898 AND
per user $209
Source:
Redmond Channel Partner
As of March 23, 2012
* Price doesn’t include Software Assurance

Saturday, March 31, 2012

Profitability Analysis–SQL Server 2012 SSIS and SSAS meets JD Edwards

JDEI am wrapping up a profitability analysis project for a global medical manufacturing company. The goal was to give the management team a Business Intelligence application to show profitability margins for customers, products, geographic locations, and production facilities. The solution provided OLAP reporting on profitability metrics by while supporting multiple currency conversions for every currency the company did business with. To deliver this solution I had to pull financial measures like revenue and expenses as well as statistics on the manufacturing process from Oracle’s JD Edwards Enterprise One.
The idea for this project was to use SQL Server 2012 and use SSIS for the ETL process and then SSAS for the cube. The users would be using Excel 2012 to connect to the cube directly. I am happy to report that I did not run across any issues related to using SQL Server 2012 even though I was using Release Candidate 3 for most of the development phase.
I came across a few things during the SSIS development phase of this project that I wanted to pass along to others business intelligence folks who may be pulling from JD Edwards / Oracle database.
1.  Configure 34bit and 64bit OLE DB Oracle providers following Greg Galloway instructions. These instructions are fantastic. I can appreciate these instructions as I remember the wailing and gnashing of teeth that took place the first time I had to setup Oracle’s OLE DB providers on a 64bit server.
2.  Decide on using linked server (TSQL) or OLEDB Source (PL/SQL). My experience was that I got noticeably faster performance when using the OLEDB Source with PL/SQL rather than using the more convenient linked server.
3.  Use existing date and time conversions. Bryant Avey had two useful TSQL functions. One converts the JD Edwards’s date fields, which are represented in Julian date format of CYYDDD where C = Century; YY = a 2 digit year and DD = the 3 digit number representing the day of the year (1 through 365 or 366 days on a leap year) to a Gregorian date. The function was called DateJ2G
CREATE FUNCTION [dbo].[DateJ2G]
 (
@JDEDATE int, @FORMAT int
 ) 
RETURNS varchar(20) AS 
--Written by Bryant Avey, InterNuntius, Inc.
--Provided free "As Is" with no warranties or guarantees
--I just ask that you keep these comments in the function, if you use it.
--The complete article describing this function can be found at:
--http://wp.me/pBPqA-a

--This function takes a JDE Julian Date and returns
--a varchar date in the format style you specify
--To us simply pass in the JDE date and the style code
--Style codes can be found at

--For Example: select dbo.DateJ2G(sddgj,101) from f4211
--would return the JDE date in the format of 02/29/2008.
--Select dbo.DateJ2G(108060, 1) = 02/29/08
--Select dbo.DateJ2G(109060, 107) = Mar 01, 2009

--Format codes are standard SQL 2005 Date Convert codes.
--Conversion codes can be found here: http://wp.me/pBPqA-a
BEGIN
DECLARE @sqldate datetime
set @sqldate =
 dateadd(day,cast((1900000 + @JDEDATE)%1000 as int)-1,(cast((
 cast((1900000 + @JDEDATE)/1000 as varchar(4)) + '-01-01')
 as datetime)))

RETURN (convert(varchar(20),@sqldate,@FORMAT))
END

The other function, DateG2J, converts a Gregorian date to a Julian Date. Again this was very useful.
CREATE FUNCTION [dbo].[DateG2J] (@Geogian_in datetime)
RETURNS int AS
--Written by Bryant Avey, InterNuntius, Inc.
--Provided free "As Is" with no warranties or guarantees
--I just ask that you keep these comments in the function, if you use it.
--The complete article describing this function can be found at:
--http://wp.me/pBPqA-a
--This function takes a varchar gregorian date and returns
--a Julian JDE Date
--To use simply pass in the string date
--For Example: select dbo.DateG2J('02/29/2008')
--would return the JDE integer date of 108060.
--Date input formats are standard SQL 2005 DateTime values.
--Any validly formated date string will work such as 'feb 29,2008' to get 108060.
BEGIN
declare @JulianDate_out INT
declare @Century INT
declare @YY INT
declare @DayofYear INT
Select @Century = case when datepart(yyyy,@Geogian_in) > 2000
then 100000 else 0 end
Select @YY = CAST((SUBSTRING(CAST(DATEPART(YYYY, @Geogian_in)
AS VARCHAR(4)), 3, 2)) AS INT)
select @DayOfYear = datepart(dayofyear, @Geogian_in)
SELECT @JulianDate_out = @Century + @YY * 1000 + @DayofYear
RETURN(@JulianDate_out)
END
I created a third function to validate and format the JD Edward’s time fields into a valid time field for SQL Server. My experience is that JD Edwards allows any combination of integers that may have not necessarily represented a valid time in SQL Server (or anywhere else for that matter). The ValidateJDETime function helped deal with this by checking the time and setting it to midnight if an invalid time was found.
CREATE FUNCTION [dbo].[ValidateJDETime] (@IN_Time VARCHAR(10) )
RETURNS CHAR(8)
AS
--Written by Thomas M. Puch
--Provided free "As Is" with no warranties or guarantees
--I just ask that you keep these comments in the function, if you use it.

----Usage:  SELECT dbo.ValidateJDETime ( '112233')
BEGIN
     DECLARE @RV CHAR(8),
                 @vt AS CHAR(6),
                  @vh AS CHAR(2),
                  @vm AS CHAR(2),
                  @vs AS CHAR(2)

SET @vt = REPLACE(STR(@IN_Time, 6), SPACE(1), '0')

SET @vh = SUBSTRING(@vt, 1,2)
SET @vm = SUBSTRING(@vt, 3,2)
SET @vs = SUBSTRING(@vt, 5,2)

IF (@vh BETWEEN 0 AND 23 AND
    @vm BETWEEN 0 AND 59 AND
    @vs BETWEEN 0 AND 59)
  BEGIN
     SET @RV = @vh + ':' + @vm + ':' + @vs
  END
ELSE
  BEGIN
     SET @RV = '00:00:00'
  END
RETURN(@RV)
END
4. Planning to deal with NCHAR and NVARCHAR2 is something you will want to do early on . Most text fields in JD Edwards are either NCHAR or NVARCHAR2 that are padded with trailing or in some cases leading spaces. Trailing or leading spaces need to be accounted for when matching up to other data using the SSIS Lookup transformation especially if you are joining to data from text files or other source systems. It is likely that the other data sources will not have trailing or leading spaces. This will cause the SSIS Lookup transformations to not find a match in SSIS. This can be time consuming to troubleshoot because at first look the data seems to match and even joins together in a TSQL query. I would suggest using the TRIM function in Oracle on every text field in your PL/SQL query to JD Edwards. This function will remove trailing and leading spaces and will allow your SSIS Lookup Transformations to find matches.
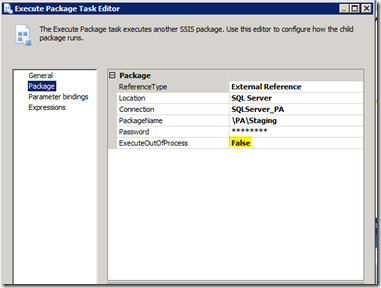
5.  When using the Oracle OLE DB provider I found that the property called ExecuteOutOfProcess, found in the Execute Package Task had to be set to FALSE if the sub-package used the Oracle OLE DB provider. This was also pointed out in Greg Galloway’s instructions. Like Greg, I did not really investigate why, but set the configuration and moved on.
SQL Server 2012 SSIS ExecuteOutOfProcess

Friday, February 3, 2012

Connecting R to Microsoft SQL Server

R

Connecting R to SQL Server to pull data from a SQL Server data warehouse or data mart is something you may want to consider if you need to do advanced statistical computing.

Assuming you have R already installed, the prerequisite steps are first you have to download and install the RODBC package.  This was done by using the menu options found under the Packages menu in the Rgui.   The second thing to do is create an ODBC data source.  I created a system data source for SQL Server.  I configured my server and default database, making sure to point the default database to the database I wanted to connect to.  In this case I was connecting to the CatchAll database.  I did not feel very creative so I called the ODBC connection the same name as the database.

image

The first line calls the RODBC package that supports ODBC calls.

The second line creates the connection using your ODBC connection your created previously.

The third line runs your SQL query. You can query a table or a view.  The output is sent to a data frame called “dataframe”.

Finally in the fourth line the connection is closed and in the fifth line I displayed an average of the price field in my data frame to show that in fact the dataframe has been populated.

Wednesday, December 14, 2011

SQL Saturday #119 – Chicago

sqlsat119_webSQL Saturday #119 is scheduled for May 19, 2012 and will be at DeVry University in Addison, IL. This is a free event but there is a $10 charge for lunch. Sign up soon as last year it was “sold out” weeks before the actual date.

This is a good way to learn new tricks with the Microsoft BI tools as well as SQL Server in general, but also to network with other folks (Microsoft folks, MVPs, PASS folks, authors of SQL books, and some really smart people who enjoy sharing what they know.)

I’m signed up and would encourage you to consider attending.

Thursday, November 10, 2011

Columnstore Index In the Wild - A First Look At a Columnstore Index In SQL Server 2012

I had a chance to do a proof of concept project with a client who was looking to migrate from an unsupported version of Sybase IQ to SQL Server 2012. The client was interested in keeping the database as similar as possible and then point the existing BI reporting applications to the new SQL Server. The client was also interested in proving that SQL Server can perform as well as Sybase IQ. Remembering that Sybase IQ is one of the leading high end column oriented databases that stores data in columns, rather than rows, this seems like a bit of a challenge. I thought this would be a nice chance to take a real world look at SQL Server 2012's new columnstore index.columnstore index

There is a comprehensive article by Eric N. Hanson about the requirements and things to consider when implementing a columnstore index. I suggest reading this article before you get started so you can get an idea on the memory requirements and make an informed decision on the number and length of columns your server can support.

I wanted to give some information on the server and data characteristics so you can compare this to your environment. The server used for the proof of concept project was a virtualized server with Windows 2008 R2 (64bit) that had 2 cores, 8 GB memory, and SQL Server was setup with 7GB cap. The main fact table used for the proof of concept project was loaded with 25 million rows and contained almost 100 fields. The size of the table came out to about 20GB.

Creating the columnstore index could be done using SQL Server Management Studio by clicking on any table and then clicking on the indexes folder. You will now have the option to create a traditional binary tree index as well as the new columnstore index. This should be familiar as creating any other index. The index can be saved off as a script and executed later.

A few things I came across worth mentioning is that, first a table can only have one columnstore index. This is covered in all the documentation, but the implication is that you will need to put some thought into what columns will be included as putting all the columns in the columnstore index is not always possible since there is a memory requirement. This is also covered in Eric's article which gives the formula you can use to calculate the memory size required.

Second, INSERTS, UPDATES, and DELETES are prohibited on columns in a table that are included in a columnstore index. The columnstore index must first be DISABLED. After you are finished updating the table the index has to be REBUILT. Additionally any ALTER TABLE statements on the table are not allowed on the columns that are included in the columnstore index until you DISABLE the index. This seemed logical after thinking about it, but was surprised when I got the error message since this is a difference between a traditional binary tree index.

Third, you can verify if a query is using a columnstore index by looking at the execution plan in SQL Server Management Studio. Again this technique is no different than a traditional index.

Fourth, as expected, the columnstore will only be available in the Enterprise Edition only.

It took about 5 minutes to rebuild the columnstore index, which seemed reasonable when considering the table size I was working with.

The SQL below was used to create the columnstore index. Every column that was used in all the test reports were included in the columnstore index.

CREATE NONCLUSTERED COLUMNSTORE INDEX [invoice_line_IDX_CS] ON [POC].[invoice_line]

(

[year],

[period],

[item_no],

[cust_no],

[invoice_no],

[line_no],

[charge_cust_no],

[srep_code],

[quantity],

[selling_uom],

[ship_name],

[ship_addr1],

[ship_addr2],

[ship_to_city],

[ship_to_state],

[ship_to_zip],

[invoice_date],

[order_type],

[record_updated],

[total_pkg_qty_per_sku],

[total_product_quantity],

[net_sale_amt]


)WITH (DROP_EXISTING = OFF) ON [PRIMARY]

GO

Two Execute SQL Tasks were added to the SISS package that loaded the main fact table. The first Execute SQL Task to disable the columnstore index was added just before the load and the second Execute SQL Task was added just after the load.

ALTER INDEX [invoice_line_IDX_CS] ON [POC].[invoice_line] DISABLE

GO


--LOAD TABLE USING SSIS


ALTER INDEX [invoice_line_IDX_CS] ON [POC].[invoice_line] REBUILD

GO

4 basic reports that represented common user requests in the environment were used to compare report performance when using Sybase IQ, SQL Server with a traditional binary tree index, and SQL Server with a columnstore index. The reports were executed using two different BI reporting tools. This is represented in the chart below as "A" and "B". One BI reporting tool is "A" and the other was represented as "B". The time represents the total report execution time in seconds which includes data retrieval and internal report processing by the BI reporting tool.

The reports used simple SQL. Nothing fancy or complex here. Report 1 simply summed invoice amount by all years, while Report 2 filtered on a single sales zone and then summed invoice amount by year. Report 3 was similar to Report 1 (summed invoices amounts by all years) but was based on a view that included extra columns. Report 4 was also based on the same view and was similar to Report 2 (filtering on a single sale zone and then summing on invoice amount by year) .

clip_image001

Obviously the newer, 64bit hardware SQL Server outperformed Sybase running on older 32bit hardware.

In most cases the columnstore index improved query time and was impressively fast, but it always was not faster than the binary tree index. Report 1b was actually slower and Report 2b was the same. This may have more to due with the processing time by the BI tool rather than the data retreval time, but a deeper look is needed here to understand this observation. Overall, I was pleased with the columunstore index as it was easy to setup and offered a noticeable performance improvement to most report users.

A columnstore index will help reports that summarize data on an aggregate level (SUM, MIN, MAX, AVG). A traditional binary tree index will still have their place to help retrieve a few rows using highly selective filters as this not really the strength of a columnstore index. This leads me to ask "As a BI practitioner, where does it make sense to use a columnstore index ?"

Speed up existing reports may be one idea. Some reports that may have not been considered online reports can now be deployed in an interactive online way. I would think that if this were truly the case you would have already created a SSAS cube. Interesting enough, I did have a project where I had to create a SSAS cube using HR data for this very reason. The report needed to run embedded in a .Net web application with a 1 -2 second response time. After spending time performance tuning and reindexing, I turned to creating an SSAS cube which ended up giving under 2 second response time for the report queries. In a case like this, a columnstore index may have been something to consider since it would have avoided having to create and process an SSAS cube.

A second idea was that a columnstore index can be used as a replacement for aggregate table. In 1999, aggregate tables seems to be more common. Now a days I honestly don't remember having a need for them on any recent projects. Today I would tend to rely on a SSAS or a Cognos cube instead. So I am not sure about this idea.

I also thought up third idea when thinking back on a previous client where I was working with a company on a medium size SSAS cube that contained quality data. The company had many poorly performing SSRS reports that used MDX and a SSAS cube. The company's IT staff was not comfortable with MDX or SSAS , but did have strong skills in SQL and SQL Server. A company like this may be an ideal candidate for a columnstore index. It can support their SSRS reports and take advantage of their strengths in SQL and SQL Server. I would think that there are cases where a columnstore index may meet the reporting needs and avoid the complexities that come with MDX and SSAS.

I would be curious to hear if you have any other ideas for potential applications of the columnstore index.

Friday, October 14, 2011

SQL PASS 2011 Summit in Seattle, WA

I wanted to share my top ten list on the topics I felt were significant and received a lot of attention at SQL PASS 2011 Summit. It was reported that this year’s SQL PASS Summit was the largest everyseattle-public-market with 5000+ reported participants. Personally, it is always fun to chat with other SQL Server folks and the SQL Server celebrities (i.e. authors, bloggers, the SQL Server product development team, and the SQLCAT team).

Without any other formalities, here is my top ten list of significant topics at the  SQL PASS 2011 Summit:

Number 10  BI Semantic Model was something the Microsoft BI stack often got discounted for not having when companies did product evaluations against Business Objects, Cognos, and MicroStrategy or in reviews by Gartner Group. The BI Semantic Model (BISM) will expose the complex data structures in a simpler way that use business friendly terms which will become the foundation for self-service and ad hoc reporting for non IT staff.

Number 9   Hadoop connectors and Linux ODBC drivers will be available. These type of connectors will surround these technologies to provide a gateway to the Microsoft BI stack. The Linux ODBC drivers will be useful when doing migrations from databases on Linux to SQL Server.

Number 8   Powershell is the scripting language for administration for Windows, SQL Server, and SharePoint. There was a lot of buzz on learning Powershell to do setup and administration. Many of the setup tools actually use Powershell in the backend and provide the script before it is executed. This is a nice feature as the script can be saved to a file for reuse latter or be a good way to learn Powershell.

Number 7   Change Data Capture extended to Oracle was announced to be in SQL Server 2012.

Number 6   Data Mining - Noticeably missing in action was any update on the Data Mining Excel 2010 Add-On in the SQL Server 2012 release. Currently, the Data Mining Excel Add-On is only officially supported for Excel 2007.  I was told by a SQL MVP that the SSAS team was focused on delivering Power Pivot v2 and Power View, but that updating the Data Mining Add-On for Excel 2010 is unofficially planned within the next year. There was a lot of buzz about using DMX queries to visualize data mining output in SSRS and using DMX queries to bring insights into SSIS or online web applications. This is a big positive. The message to me was that the pieces are in place to embed data mining insights to end users. I also had the chance to get familiar with a company called Predixion (aka the old Microsoft Data Mining team).  They had an interesting cloud based analytics tool that used Excel 2010. It looked promising and to be tailored for small to medium sized companies.

Number 5  SQL Server Reporting Service (SSRS) will support data driven alerts created by end users. This will be a first version so formatting is somewhat limited, but the idea will be that a user can create their own alerts to be emailed to them when data conditions exist that require immediate action. Additionally SSRS will  be available as a service application in SharePoint. This improves performance to get integrated mode on par with native mode and simplifies setup. SSRS will still be available in native mode, but integrated mode will be required for the new alerting feature.

Number 4  There was a lot of buzz about “AlwaysOn”. This is high availability (HA) feature that uses something know as Available Groups (AGs) which are a combination of the best of SQL Server Clustering (same IP) and database mirroring while not having a requirement for share storage. AGs support off site replication. This should make HA easier to deploy and reduce hardware dependencies.

Number 3   Improvements in information retrieval of unstructured documents (PDF, Word, and Excel) in the SQL Server 2012 database engine. There are performance improvements in Full Text Search, but the two more significant new features called Semantic Search and File Table. Semantic Search gives the ability to find documents that are similar to a given document. File Table is a new object is SQL Server 2012 and uses FileStream functionality to query the files in a given directory. The File Table object is update immediately as soon as files are copied to the directory the File Table is configured to. Semantic Search is very exciting to me.

Number 2   Column Store index is database structure that stores data using Vertipaq which allows data to be stored in a more compressed format to reduce physical IOs. Historically column store technology was a high end feature available in products like Teradata and Sybase IQ. The column store index will significantly improve performance of queries that scan many rows, such as queries that scan large fact tables. It was reported that queries taking minutes can now take seconds.

Number 1   Power View (formerly know as Project Crescent) is the ad hoc reporting application presented through a browser via Silverlight. Microsoft made a huge investment in this technology as it is seen as Microsoft's answer for mobile BI. Power View will allow users to create reports using the BI Semantic Model. The reports are very interactive and support self-service ad hoc reporting. It also supports animating charts on a time dimensions to visually show trend information changing over time. Power View is very visual and very eye catching.  All in all, Power View was the buzz of PASS 2011. It carries a huge WOW factor that end users will be please with. With any good thing there is a catch. The catch here is that implementing Power View in most environments is not a trivial task. It involves multiple technologies, security topologies, and communication protocols. The challenge will be to understand SharePoint 2010, PowerPivot, SQL Server Reporting Services, Excel Services, SQL Server Analysis Services, BI Semantic Model, Sliverlight, and the various security architectures (classic Windows authentication and claims authentication) to successfully implement this solution in medium to larger environments.